2.4.5 Asset Assignment - 401(k)
"Diversification is the only free lunch in investing." — Harry Markowitz
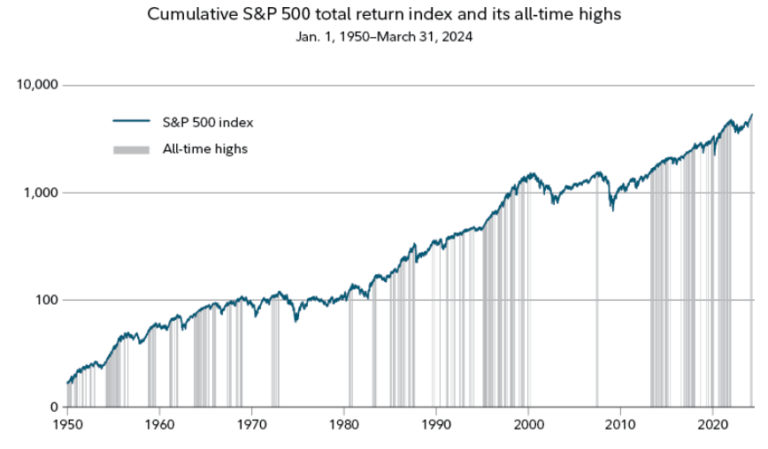
Investing your 401(k) funds in the S&P 500 can be one of the smartest moves for building a solid financial future. The S&P 500, comprising 500 of the largest publicly traded companies in the United States, represents a diversified mix of industries and sectors. This diversification spreads risk and reduces the impact of any single company’s poor performance on your overall portfolio. By investing in the S&P 500, you’re essentially putting your money into a cross-section of the American economy, which historically has shown consistent growth over the long term.
One of the key advantages of the S&P 500 is its strong track record of performance. Over decades, it has delivered an average annual return of around 10%, making it a reliable vehicle for growth. When you invest in your 401(k), you’re usually in it for the long haul, and the S&P 500’s steady growth can help your retirement savings compound significantly over time. This means your investments can potentially double or even triple, depending on your time horizon and the market’s performance.
Another benefit of investing in the S&P 500 within your 401(k) is the low cost associated with this type of investment. Many 401(k) plans offer S&P 500 index funds with very low expense ratios, which means more of your money is working for you rather than being eaten up by management fees. Additionally, the passive management of index funds tends to be more cost-effective compared to actively managed funds. This cost efficiency, combined with the tax advantages of a 401(k), maximizes the growth potential of your retirement savings.
Lastly, investing in the S&P 500 aligns well with the principles of dollar-cost averaging, a strategy that involves consistently investing a fixed amount of money at regular intervals, regardless of market conditions. Your 401(k) contributions typically follow this strategy since they are deducted from your paycheck automatically. Over time, this approach helps mitigate the impact of market volatility, as you buy more shares when prices are low and fewer when prices are high, potentially lowering your overall cost per share.
In summary, putting your 401(k) money in the S&P 500 offers diversified exposure to the U.S. economy, a strong historical performance, low investment costs, and the benefits of dollar-cost averaging. These factors collectively contribute to a robust and efficient strategy for growing your retirement savings and achieving long-term financial security.
"Over the long term, the S&P 500 has proven to be one of the best investments you can make." — Warren Buffett
Top S&P 500 Funds from Brokerages
Here are the popular S&P 500 funds from different brokerages along with their expense ratios:
Vanguard
- Vanguard 500 Index Fund (VFIAX): Expense Ratio: 0.04%
- Vanguard S&P 500 ETF (VOO): Expense Ratio: 0.03%
Fidelity
- Fidelity 500 Index Fund (FXAIX): Expense Ratio: 0.015%
- Fidelity ZERO Large Cap Index Fund (FNILX): Expense Ratio: 0.00% (Note: FNILX is not an ETF but a mutual fund with no expense ratio.)
Charles Schwab
- Schwab S&P 500 Index Fund (SWPPX): Expense Ratio: 0.02%
- Schwab U.S. Large-Cap ETF (SCHX): Expense Ratio: 0.03%
BlackRock (iShares)
- iShares Core S&P 500 ETF (IVV): Expense Ratio: 0.03%
SPDR
- SPDR S&P 500 ETF Trust (SPY): Expense Ratio: 0.0945%
T. Rowe Price
- T. Rowe Price Equity Index 500 Fund (PREIX): Expense Ratio: 0.19%
State Street Global Advisors
- SSGA S&P 500 Index Fund (SVSPX): Expense Ratio: 0.16%
Invesco
- Invesco S&P 500 Equal Weight ETF (RSP): Expense Ratio: 0.20%
Important thing to keep in mind about Expense Ratios:
Selecting funds with low expense ratios is crucial for maximizing your investment returns over the long term. Expense ratios represent the annual fee that funds charge investors to cover their operating costs, and these fees can significantly eat into your returns. By choosing funds with low expense ratios, you ensure that more of your money stays invested and working for you, rather than being siphoned off by high fees. This can lead to substantial savings and greater compound growth over time, ultimately helping you achieve your financial goals more efficiently.
Let’s break down the cost of a 0.03% expense ratio to see how it impacts an investment over time:
Example Calculation
- Initial Investment: $10,000
- Annual Expense Ratio: 0.03%
Year 1:
- Expense Cost = $10,000 * 0.03% = $10,000 * 0.0003 = $3
Year 2 (assuming no additional contributions and a constant account balance for simplicity):
- Expense Cost = $10,003 * 0.03% = $10,003 * 0.0003 = $3.0009 ≈ $3
Over 10 Years
Let’s assume your investment grows at a conservative average annual rate of 7%:
Year 1:
- Initial investment: $10,000
- Expense: $3
- End-of-year balance: $10,000 * 1.07 – $3 = $10,700 – $3 = $10,697
Year 2:
- Start-of-year balance: $10,697
- Expense: $10,697 * 0.03% = $3.2091 ≈ $3.21
- End-of-year balance: $10,697 * 1.07 – $3.21 = $11,446.79 – $3.21 = $11,443.58
Repeating this calculation for 10 years, adjusting for both growth and the increasing expense cost:
Cumulative Cost Over 10 Years
To provide a simple illustration, assuming an average balance across the 10 years, the total expense cost would roughly be:
- Average annual balance (approx.): ~$14,050 (midpoint growth assumption)
- Annual expense: $14,050 * 0.03% = $4.22
Over 10 years:
- Total expense cost ≈ 10 * $4.22 = $42.20
Over 10 years, an investor with an initial $10,000 investment in a fund with a 0.03% expense ratio would pay around $42.20 in fees, assuming the investment grows at a conservative average annual rate of 7%. This illustrates how low-cost funds can help investors keep more of their returns.